Event Activity
Overview
Event Activity provides historical visibility into your event data, helping you verify tracking accuracy. It expands on the Events Received (Last 7 days) graph, enabling you to check event-level data across different dimensions, see parameter coverage, and more.
Common use cases include:
- Identify if events are being recorded correctly and which integration methods are working
- Understand how events are distributed across platforms and integration types
- Ensure that important parameters like
Order ID,Currency, andValueare being sent consistently - Track event volume over time to identify patterns or issues
If you have not restricted Pixel tracking to only report Realize conversion data (recommended for full conversion visibility), Event Activity will show data for all channels, not just conversions driven by Realize.
Open Event Activity
-
Open Realize, and select the account (top, left) that you are using to track conversions.
-
In the sidebar (left), select
Tracking. -
In the
Conversionstable, locate the conversion to analyze. -
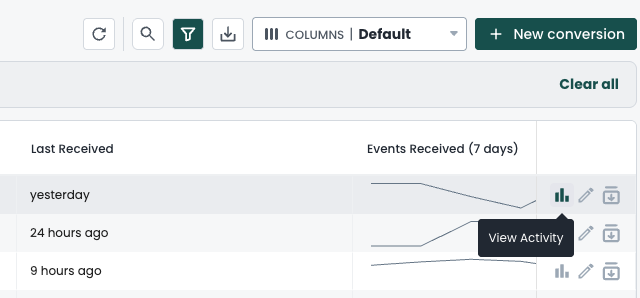
Click the
View Activity icon on the far right of the conversion row:
The icon is disabled for conversions without enough activity. (Hover over the icon to view the status.)
-
A pane slides out from the right side of the screen:
The conversion name displays on the top, left.
The Event Activity interface
Available reports
Event Activity provides 2 tabs:
Event breakdown- View event trends by integration type or platformEvent parameters- View parameter coverage for your conversion events
Date picker
Use the date picker (top, right) to report on a given date range.
You can choose from available presets or enter a custom range (up to 1 year).
Event breakdown
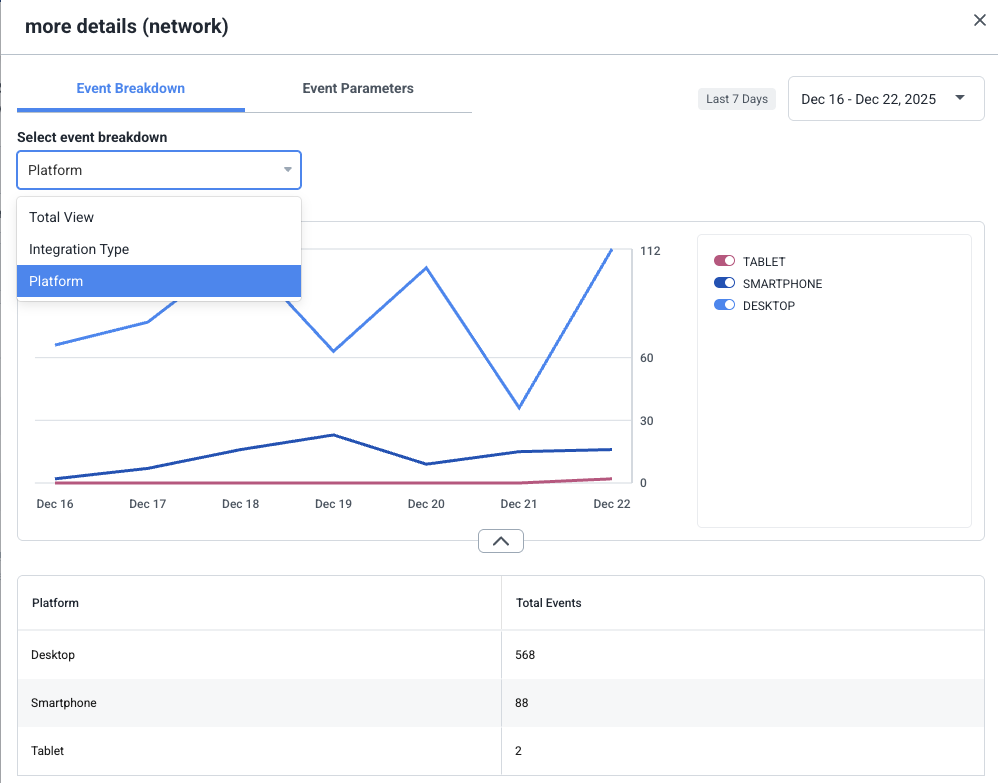
Use the Select event breakdown dropdown (top, left) to choose a breakdown:
Total view- Shows total events over timeIntegration type- Breaks down events by integration method (e.g.,Google Tag Manager,Server to Server,Pixel Manual,Shopify,WooCommerce,WordPress)Platform- Breaks down events by device platform (e.g.,Desktop,Mobile,Tablet,Smartphone)
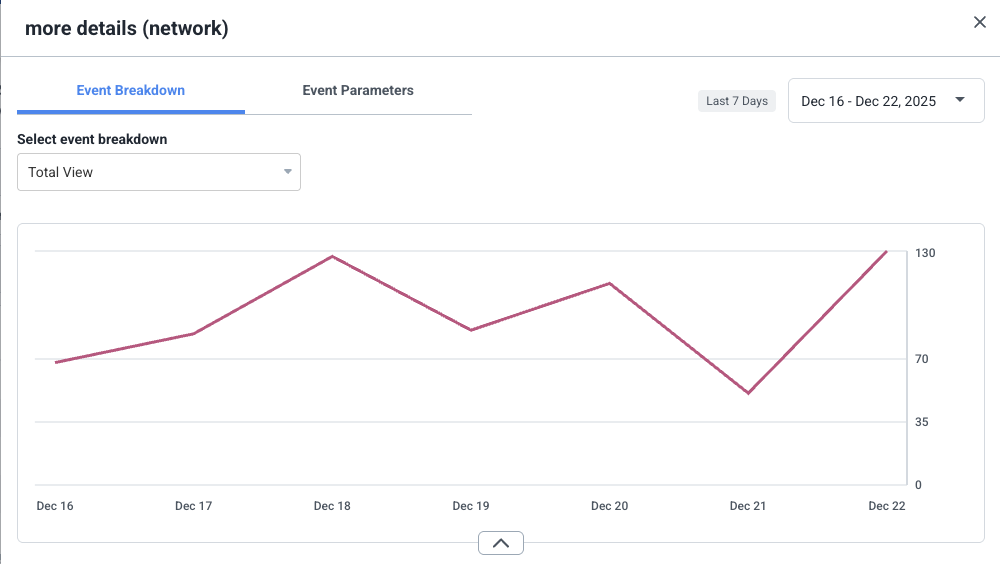
Graph view
The graph displays event trends over the selected date range.
Total viewshows a single line;Integration typeandPlatformshow multiple lines.
Table view
The table below the graph shows a detailed breakdown of the data. Columns vary by breakdown type.
TipThe table supports pagination, sorting, and can be collapsed or expanded.
Event parameters
Use the Event parameters tab to verify which parameters are being sent and how frequently:
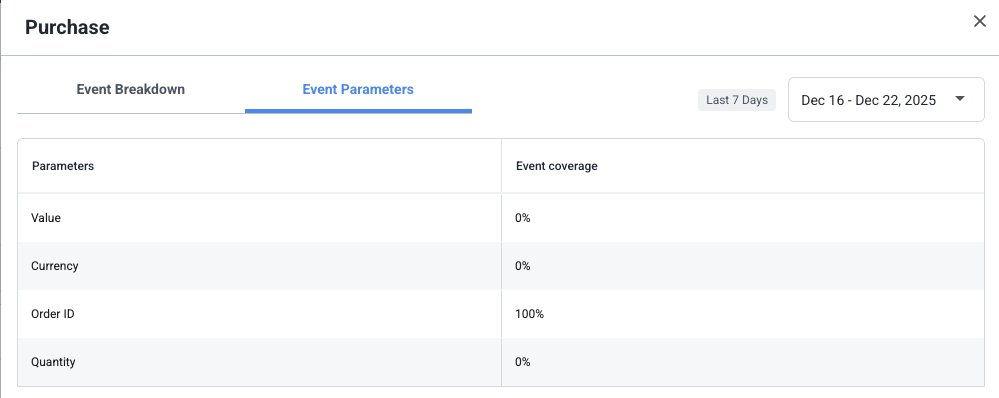
The table shows:
Parameters- The parameter nameEvent coverage- Percentage of events that include this parameter
NoteIf your conversion doesn't have additional parameters configured, the
Event parameterstab will show an empty state or indicate that no parameter data is available.
Next steps
- Missing parameters? Review your event pixel implementation or server-to-server setup
- Events not appearing? Use the Testing Tool to verify your implementation
- Integration-specific issues? See the relevant guide - e.g. GTM, Shopify, S2S
Updated 6 months ago