How to capture HAR logs
Overview
In order to troubleshoot a reported issue, Taboola Support may ask you to record a HAR file. This page provides platform-specific steps on how to do so.
For each platform, textual instructions, as well as a visual walkthrough, are provided
What is a HAR file?A HAR file contains information about the network requests made by your browser.
Privacy noticeA HAR file includes information about the cookies and pages you downloaded while making the recording.
General guidelines
- Before you capture HAR logs:
- Disable cache and reload the page.
- Execute all steps on the page where the issue occurs.
- For assistance with Developer Mode, refer to the relevant platform-specific instructions online.
- Once logs are captured, remember to turn off Developer Mode.
- Use the correct USB cable for your device.
Android cable for Android, Lightning cable for iPhone, etc.
- For cross-platform logging (e.g. iOS with Google Chrome or Android with Safari), use third-party tools like Charles or Proxyman.
Best practiceCapture logs in Incognito mode. This starts a new session and avoids caching issues.
Desktop - Google Chrome
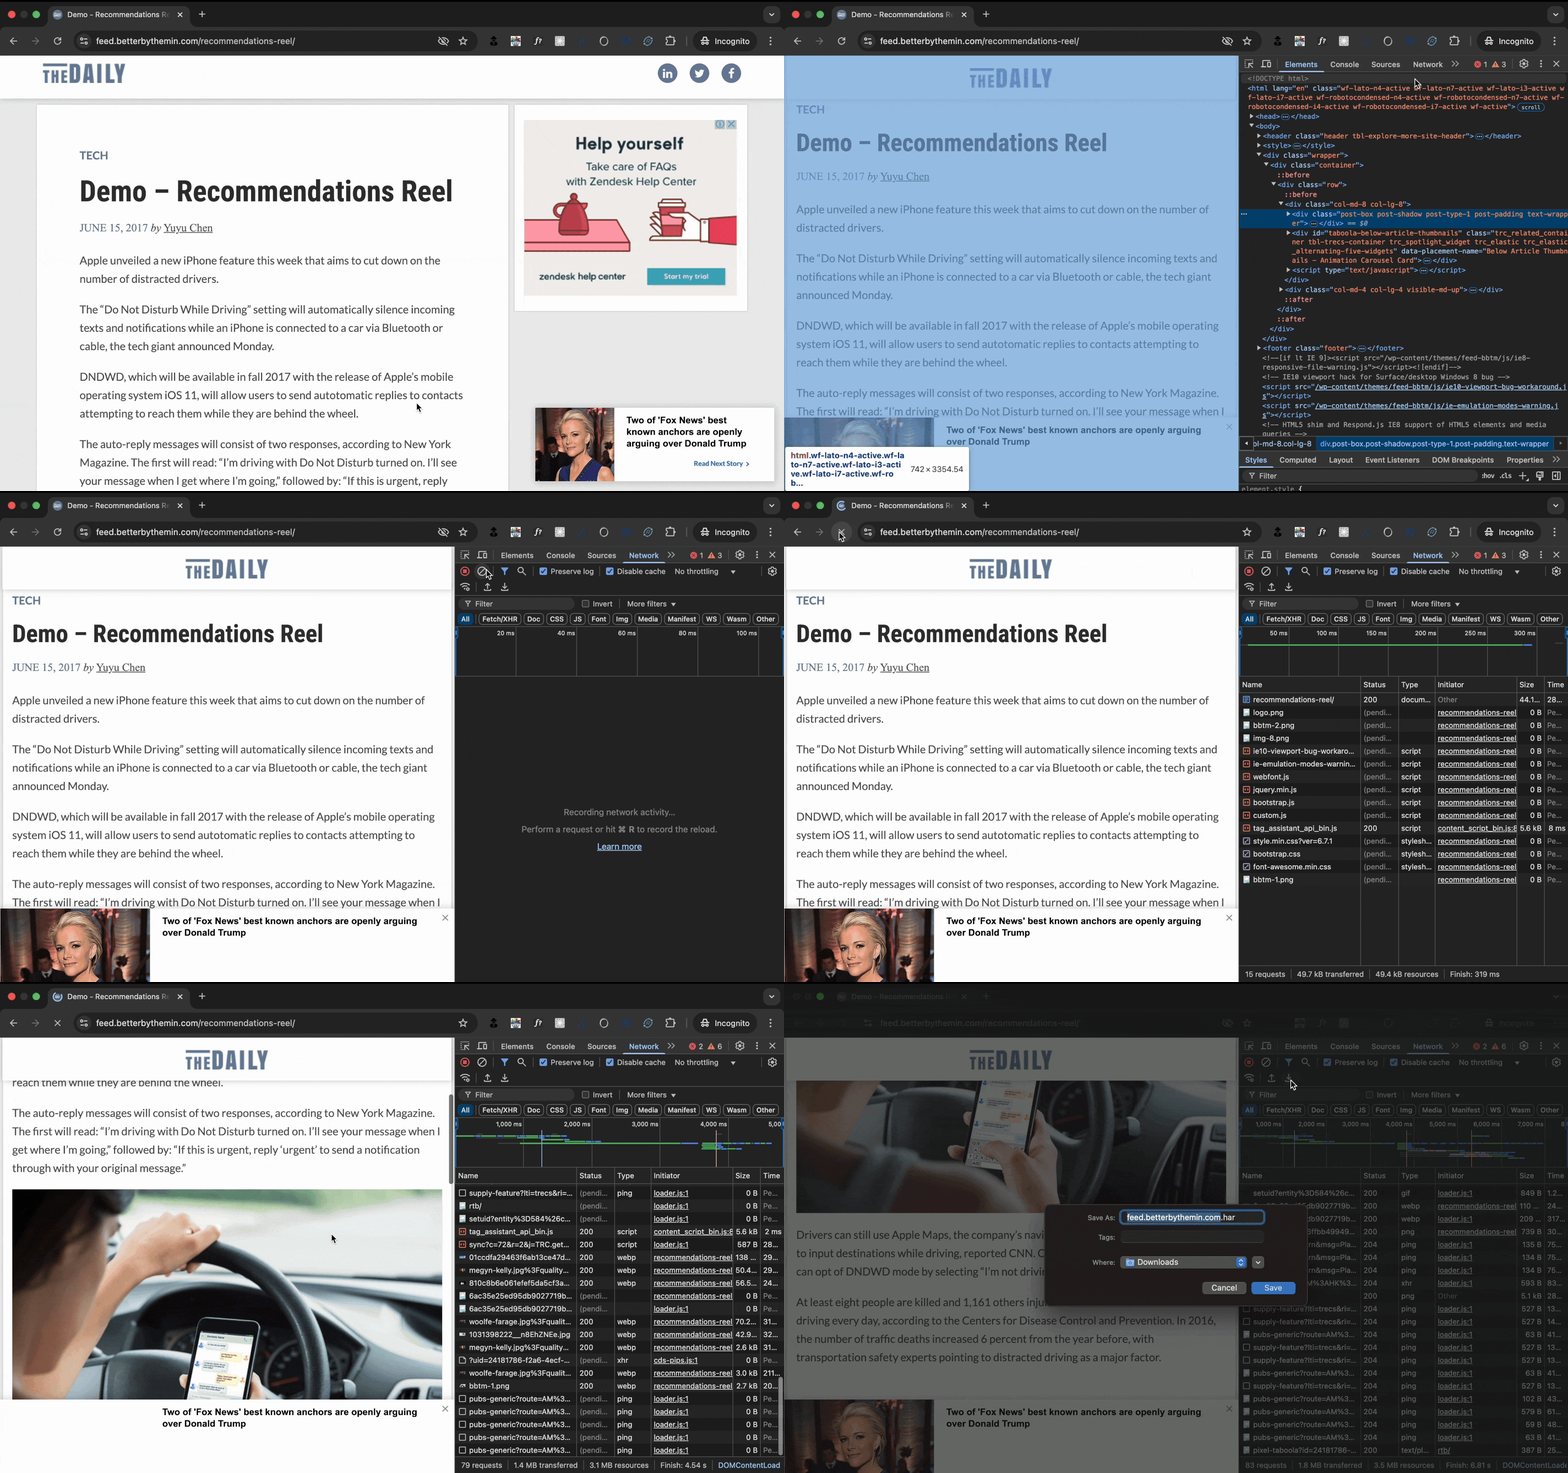
- Using Google Chrome, open an Incognito window and browse to the relevant page.
- Right-click on the page, and select
Inspectto open the Chrome Developer Tools.Or press
Cmd + Shift + I - Under the
Networktab, enable thePreserve logandDisable Cacheoptions, and click onClear(🚫). - With the Chrome Developer Tools open, reload the page and reproduce the issue.
- Click the
Download(⬇) button in theNetworkpanel and save the.harfile.

Click to zoom in (or zoom out)
Desktop - Safari
- Open Safari and go to
Develop>Show Web Inspector.If the
Developmenu is not visible, enable it using this guide. - Under the
Networktab, enable theDisable Cacheoption. - With the Web Inspector open, reload the page and reproduce the issue.
- Click
Exportand save the.harfile.

Click to zoom in (or zoom out)
Android
- Enable Developer Mode on your phone:
- Navigate to
Settings>About phoneand tapBuild number/Version5+ times.
- Navigate to
- In
Developer options, enableUSB Debugging. - Using the appropriate USB cable, connect your phone to a computer, and approve USB debugging when prompted.
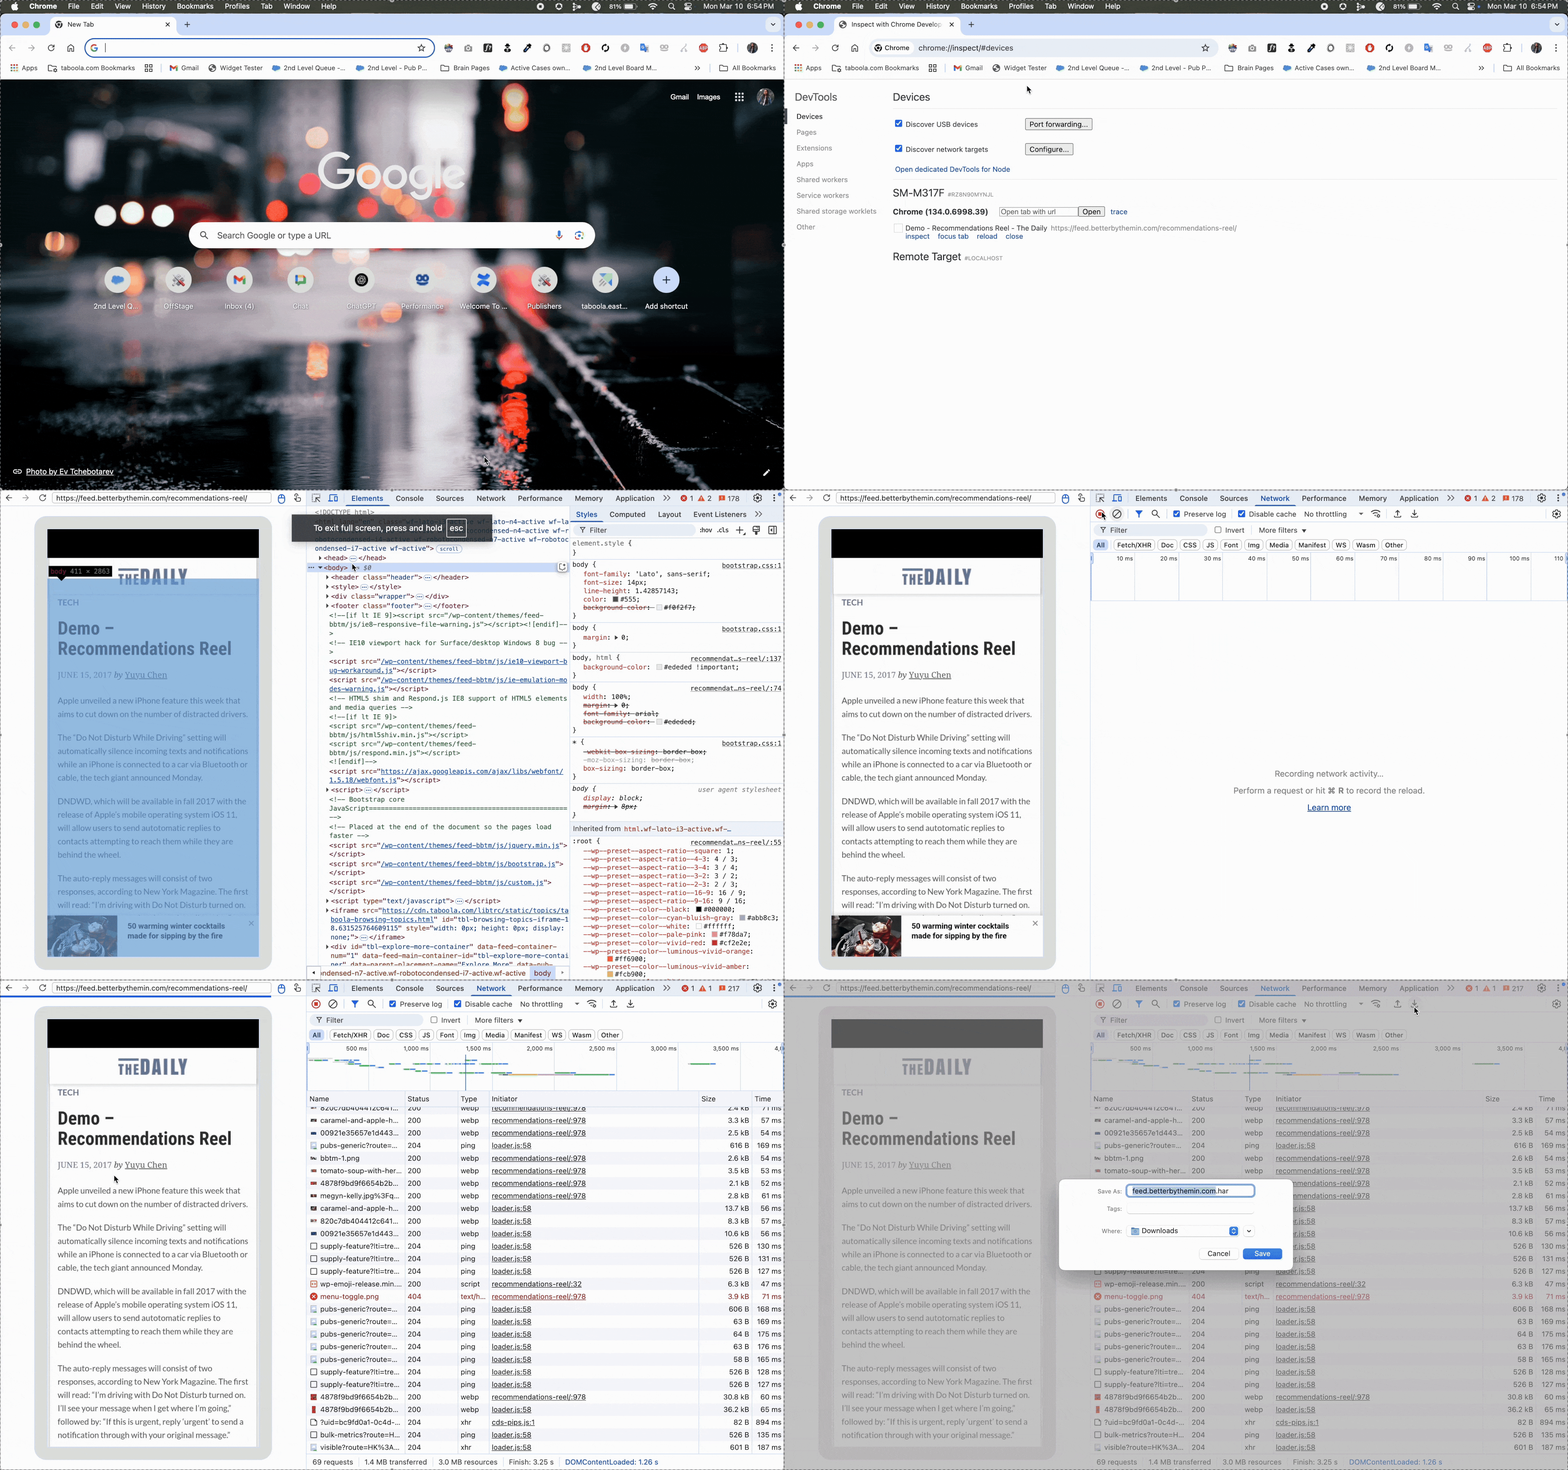
- Open Google Chrome on your computer.
- Enter
chrome://inspect/#devicesin the address bar and pressEnter. - Click
Inspectnext to the relevant page to start logging.If prompted, allow troubleshooting for the application.
- Maximize the DevTools window that appears.
- Under the
Networktab, enable thePreserve logandDisable Cacheoptions, and click onClear(🚫). - Reload the page and reproduce the issue on your mobile device.
You may need to scroll down on the mobile page.
- Click the
Download(⬇) button in theNetworkpanel and save the.harfile.
Once logs are captured, remember to turn off Developer Mode.

Click to zoom in (or zoom out)
iPhone/iPad
- Enable
Web Inspector:- Go to Settings > Safari > Advanced and toggle
Web Inspector.
- Go to Settings > Safari > Advanced and toggle
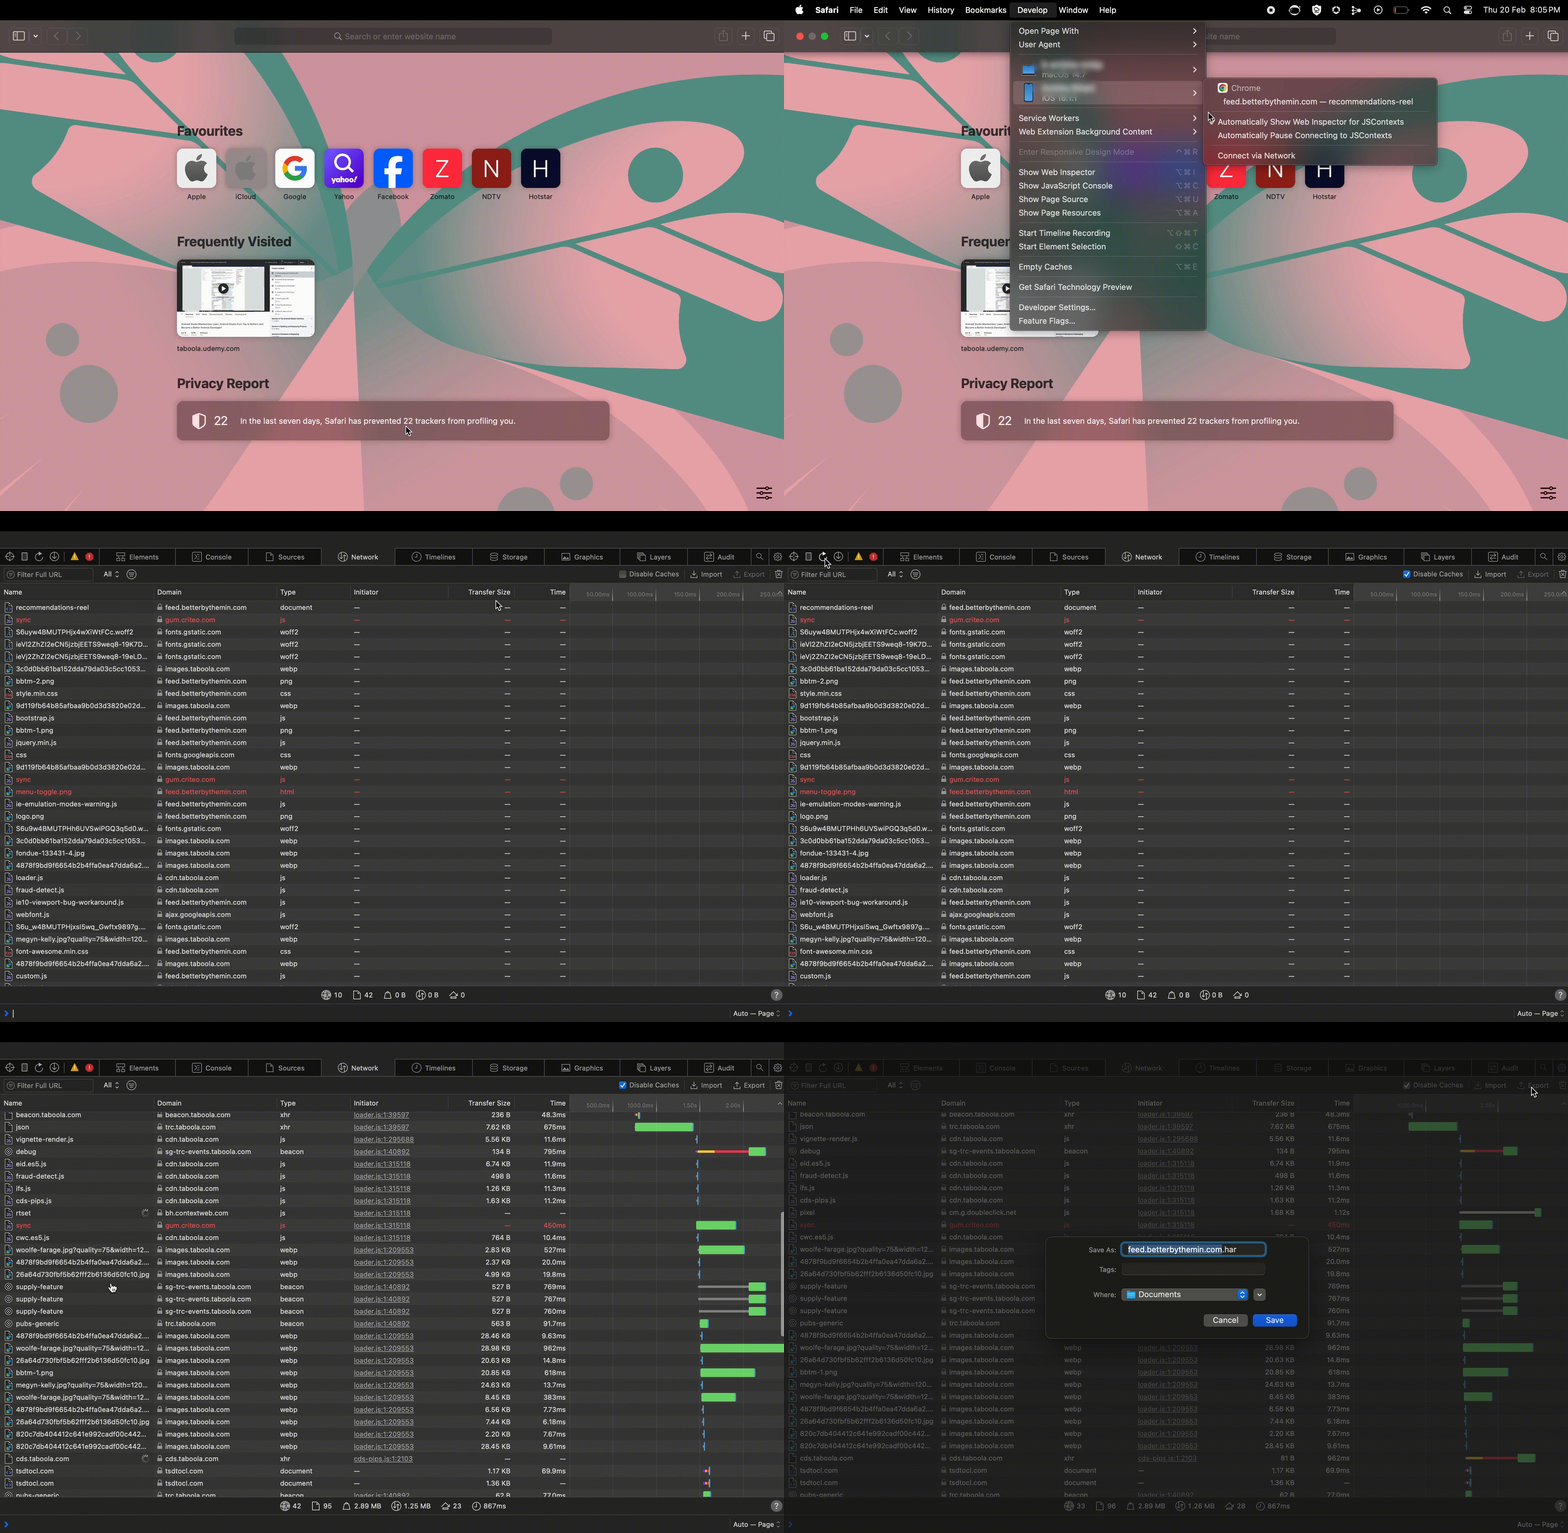
- Connect your iOS device to a Mac using a USB cable.
- Open Safari on your Mac and navigate to
Develop>[Your Device Name].If the
Developmenu is not visible, enable it using this guide. - Select the webpage you want to inspect; this will activate the developer tools.
- In the
Networktab, enableDisable Cache. - Reload the page and reproduce the issue on your mobile device.
- Click the Export icon and save the
.harfile.
Once logs are captured, remember to turn off Developer Mode.

Click to zoom in (or zoom out)
Updated 8 months ago
